☛15 Types of Graphics Designs
What is Graphics Designing
Graphics Designing is a visual communication between client and Designer. There are lots of ways to display graphics according to requirements. Very important thing is to keep in mind during design any graphics is the purpose, and where it going to be display.
Types of Graphics Designing
In today's fast proceed generation graphics has been become a back bone of all business. According to display of graphics, we can categorized in different 15 categories. These 15 categories are as follows :
1. Brand identity Graphics
2. Info Graphics
3. User Interface Design (UI)
4. User Experience Design (UX)
5. Art & Illustrations
6. Vector Graphics
6. Vector Graphics
7. Motion Graphics
8. Package Design
9. Publication Design
10. Product Design
11. Marketing and Advertisement Graphics
12. 2D Graphics
13. 3D Graphics
14. Environmental Graphics
15. Data Visualization & Charts Graphics
1. Brand identity Graphics
Brand identity graphics represents the visual identity of Business, Corporate or Individual. Brand identity graphics can be in terms of :
- Logo Design
- Visiting Card Design
- Pamphlet Design
- Brochure Design
These kind of graphics are mostly hand made combination of vectors, decorated texts and layouts. Some popular software's to make such kind of graphics are :
- Adobe illustrator
- Coral Draw
- Photoshop CC
2. Info Graphics


Info graphics is a spectacular presentation of data, graph or chart in terms of vector graphics. Info graphics is a perfect visibility of data in forms of shapes or vector art.
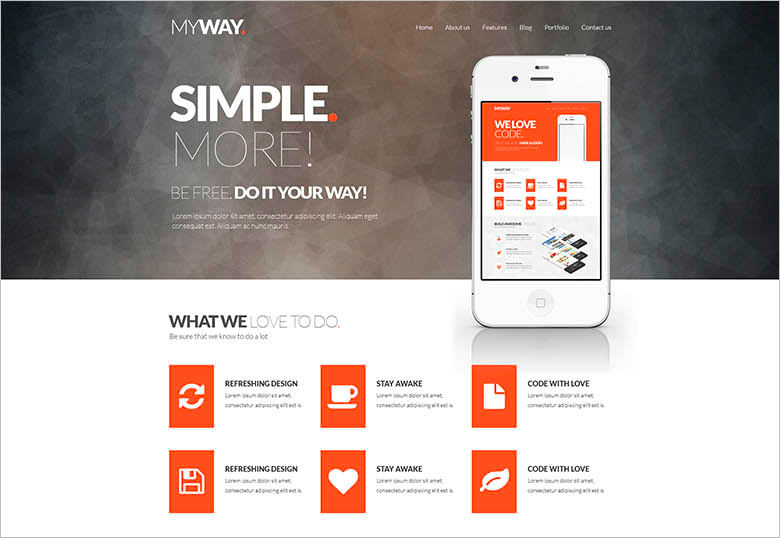
3.User Interface Design ( UI ):

4.User Experience Design (UX):

User experience design make website or application more attractive. All the part that is animate and you feel something better is called user experience. For Example : Loading image , Button Animation, layout animation, Menu animation.
User Experience design is an upgraded version of user interface. It include user interface with feel using animation or any effect.And the whole combination is called User Experience Design.
Difference between UI and UX Design :
If you would heard the phrase "Look and Feel", Then the easy way to understand is that the Look portion of any design is called user interface design and the feel represent the user experience.
Until and Unless the Design is in the of Graphical or only with Coding like HTML and CSS is called user interface design. As we include jquery or any other scripting animation in the design, it becomes a user experience design.
User Interface is just a simple design or called a Wireframe, PSD, Graphical Representation. On the other hand User experience design is visual representation of that design including feel with the help of animation or effects.
Many software are available to design User Interface like : illustrator, Photoshop, Corel Draw, Indesign etc.
For User Experience design : Adobe XD, or use front end languages like HTML, CSS, JQuery.
5. Art and Illustrations :
The design is made by hand drawing with the help of electronic pen or any other electronic equipment is called illustration.
6.Vector Graphics :
A graphics that create with the help of mathematics and geometric calculation is called vector design.
When we make any design with the help of geometric measurements using angle, circle, squire etc., that design is called vector design.
The design is made by hand drawing with the help of electronic pen or any other electronic equipment is called illustration.
7. Motion Graphics :
"Motion Graphics is animated form of vector or illustration".
To create motion graphics, first we need to draw vector or illustration multiple designs in different stages and then combine all of them in a right sequence. Motion graphics present in .gif image of short videos form.
8.Package Design :


9.Publication Design :

The Most important points for the designers is to focus on perfect layouts with paragraphs and headings including business matching fonts, vectors and images.
10.Product Design :

Like the package design, product design also a form of vector for desired clients. Similar to package design, designer prepared the products graphics with in the required measurements and then product structure created by the machines.

Marketing and advertisement graphics include banners, posters and all graphics that use for the marketing and advertisement for the company or any organization.

2 dimensional graphics are the graphics that create in two dimension X and Y. These kind of graphics usually used in cartoon movies and other animated promotion videos.

3 dimensional graphics are the graphics that create in three dimensions X , Y. and Z These kind of graphics usually used in VFX movies and other animated promotion videos.
Environmental graphics is the collection of different many vectors or illustrations to convert imaginary environment to visual environment
.
For Example : above space environment for the room.
These kind of graphics usually design for the real estate, seminars or any big events.
Data visualization & Charts Graphics similar to info graphics but in form of chart and graphs. These kind of graphics use in financial, trade and economy websites and portals to display bulk data in decades or in particular time of period.
11.Marketing and Advertisement Graphics :

Marketing and advertisement graphics include banners, posters and all graphics that use for the marketing and advertisement for the company or any organization.
12. Two dimensional graphics (2D):

2 dimensional graphics are the graphics that create in two dimension X and Y. These kind of graphics usually used in cartoon movies and other animated promotion videos.
13. Three Dimensional graphics (3D):
3 dimensional graphics are the graphics that create in three dimensions X , Y. and Z These kind of graphics usually used in VFX movies and other animated promotion videos.
Environmental graphics is the collection of different many vectors or illustrations to convert imaginary environment to visual environment
.
For Example : above space environment for the room.
These kind of graphics usually design for the real estate, seminars or any big events.
Data visualization & Charts Graphics similar to info graphics but in form of chart and graphs. These kind of graphics use in financial, trade and economy websites and portals to display bulk data in decades or in particular time of period.


